Registrierungen und Tickets
Sehen Sie Gesamtzahlen und verfolgen Sie neue Registrierungen nach Woche oder Monat.

Berichte & Analytics
Registrierungen, Verkäufe, Check-ins, Website-Besuche und Hotelbuchungen an einem Ort. Erstellen Sie eigene Berichte und exportieren Sie sie mit einem Klick.
Registrierungen, Teilnahme und Verkäufe auf einen Blick
Von der Registrierung bis zur Ankunft
0% check-in-quote
Neue Registrierungen pro Woche
Überblick
Beginnen Sie mit den Zahlen zum Verlauf Ihres Events und öffnen Sie anschließend die Details im jeweiligen Bericht.
Sehen Sie Gesamtzahlen und verfolgen Sie neue Registrierungen nach Woche oder Monat.
Vergleichen Sie verkaufte Tickets und Umsatz mit den Gästen, die tatsächlich angekommen sind.
Behalten Sie die verbleibenden Tage bis zum Event und den Status am Veranstaltungstag im Blick.
Eventberichte
Öffnen Sie gezielte Ansichten zu Teilnahme, Verkäufen und Website-Performance, statt Zahlen aus mehreren Tabellen zusammenzutragen.
Vergleichen Sie registrierte, angekommene und noch ausstehende Gäste. Sehen Sie die Live-Check-in-Quote sowie Teilnahme und Auslastung jeder Session mit Check-in – von gut gebucht bis voll.
Sehen Sie Bruttoumsatz und Verkaufsverlauf, verkaufte Tickets im Verhältnis zur Kapazität, durchschnittlichen Bestellwert und die Nutzung von Rabattcodes.
Verbinden Sie Google Analytics (GA4), um Besucher und Seitenaufrufe im 30-Tage-Verlauf, Quellen, beliebte Seiten, Geräte und Besuchsdauer zu sehen. Ohne Verbindung zeigt der Website-Bericht keine Daten.
Unterkunftsberichte
Vergleichen Sie gebuchte Zimmernächte mit Ihrem Kontingent für jedes Hotel und jede Nacht. Verfolgen Sie Buchungen im Zeitverlauf, erkennen Sie starke und ruhige Nächte und prüfen Sie die Nutzung von Koordinator-Kontingenten.
Exportieren Sie die Zimmerliste, wenn das Hotel die endgültigen Angaben benötigt.
Unterkünfte entdecken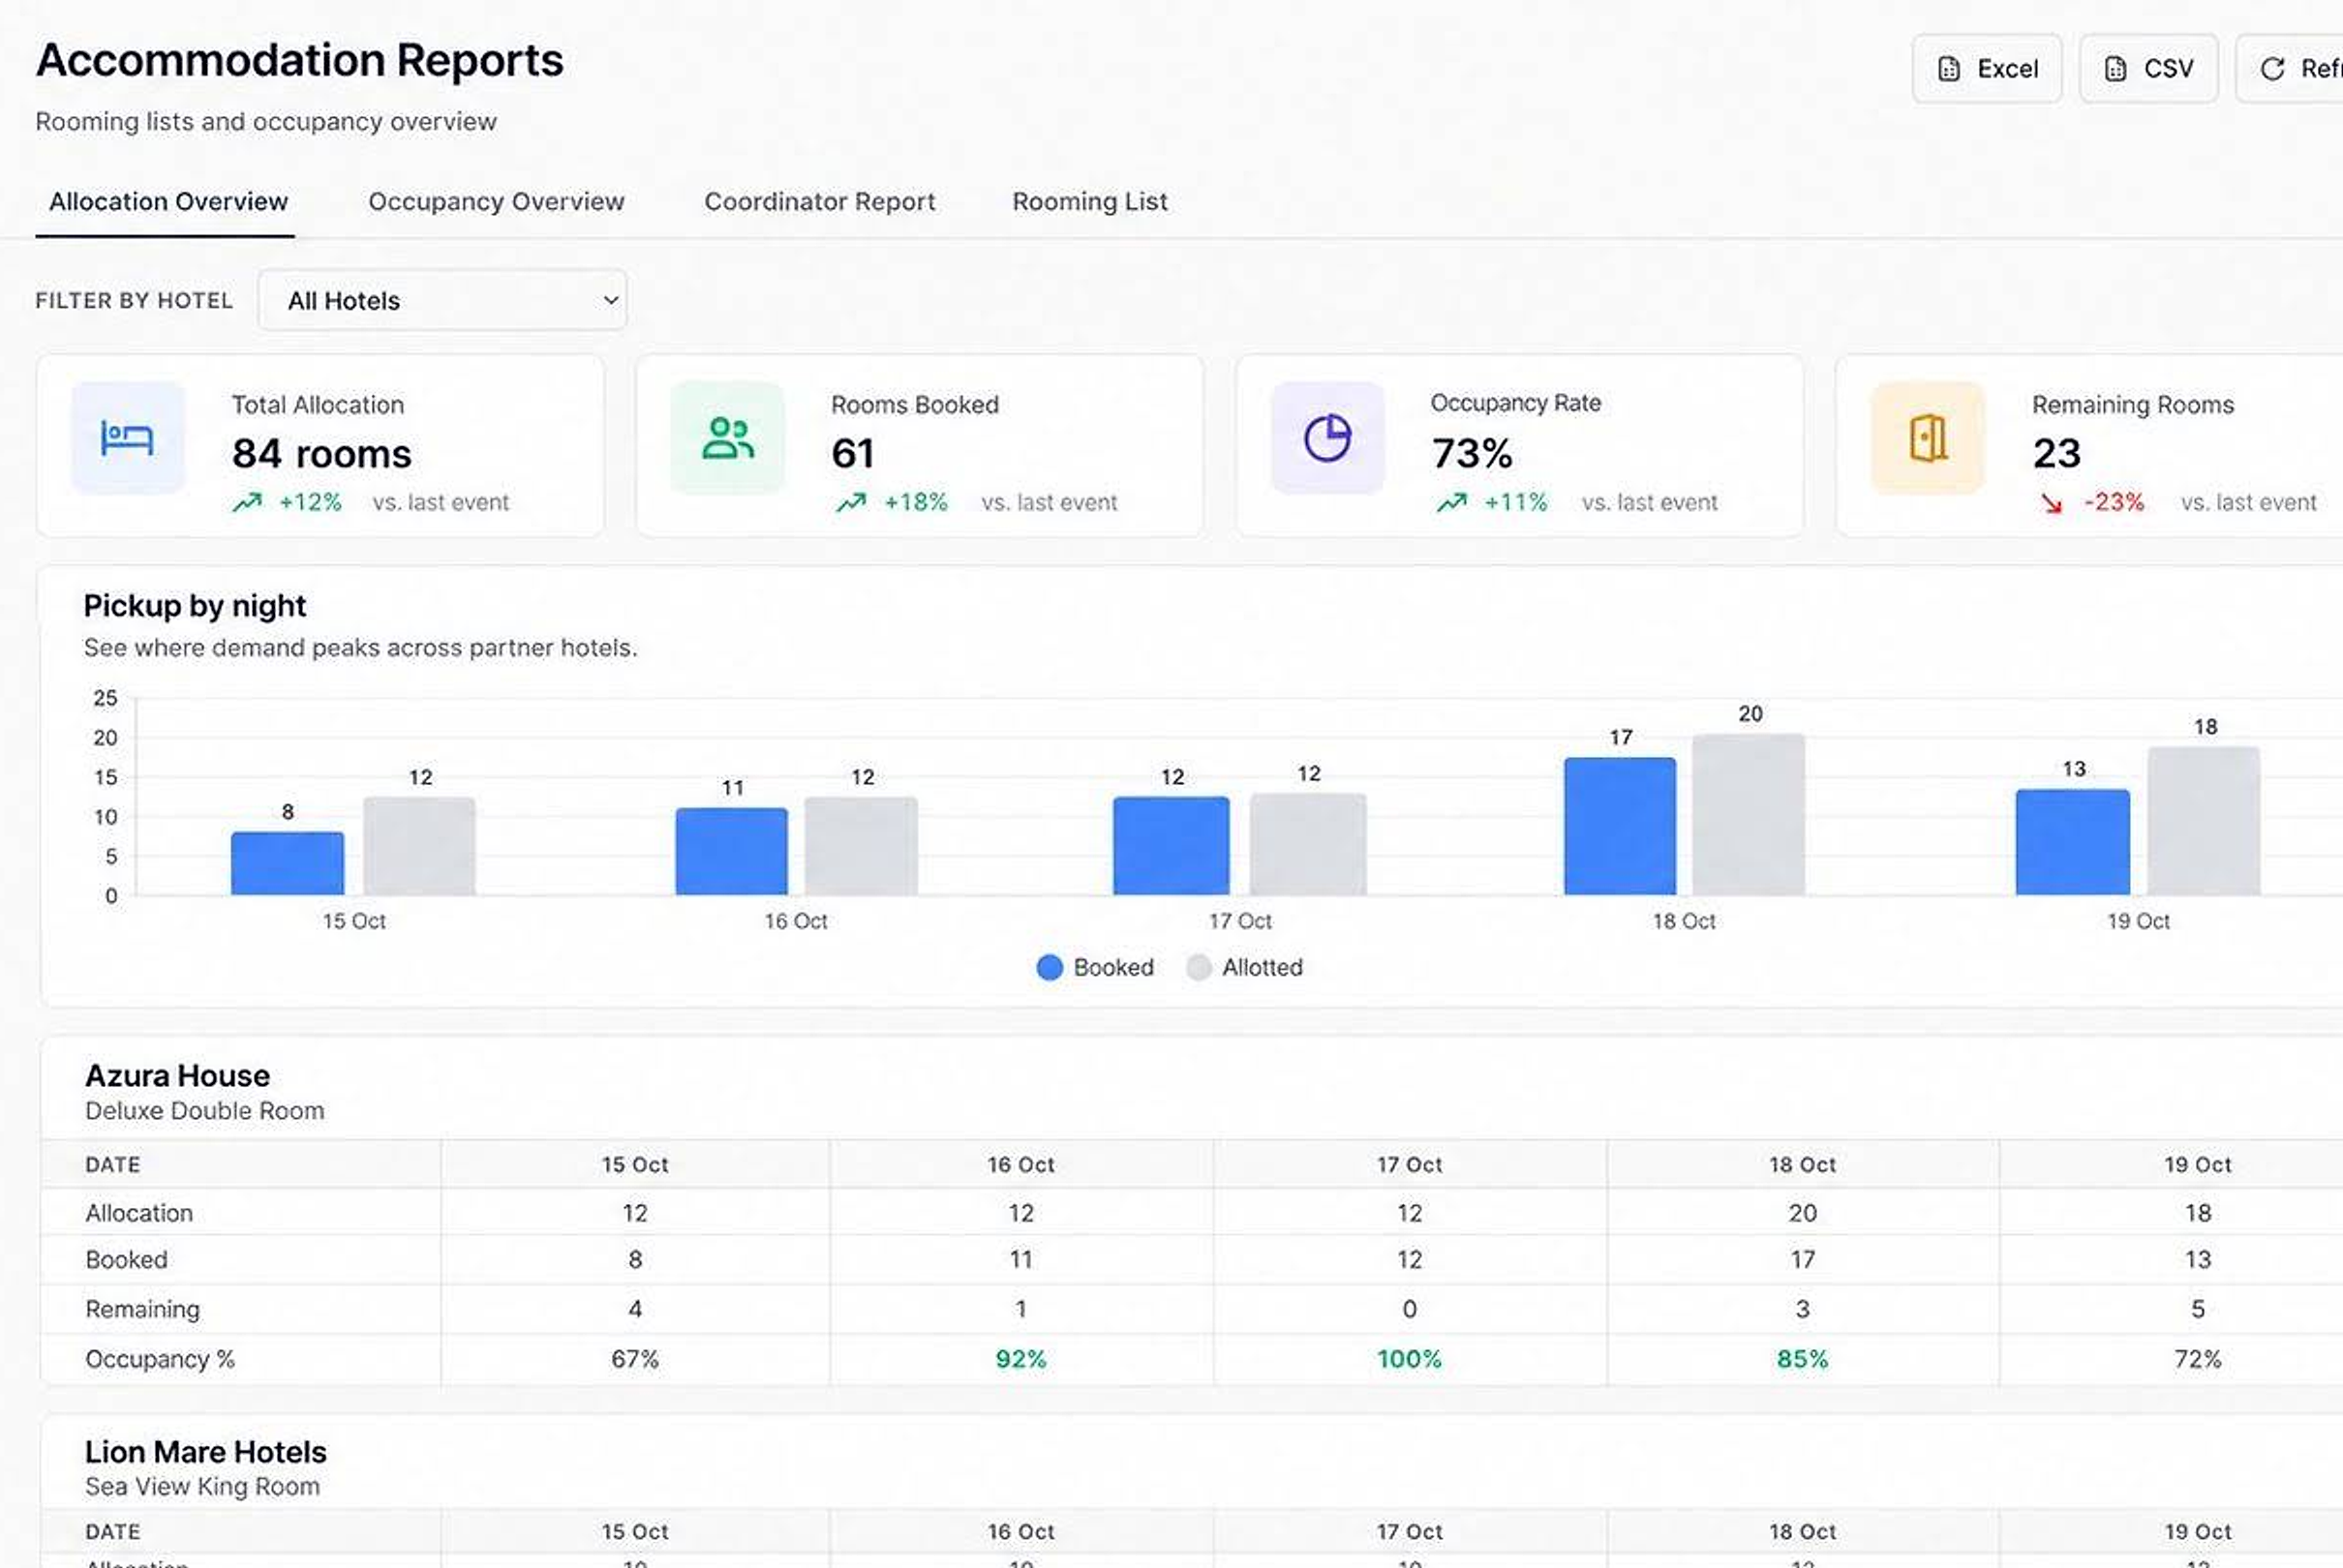
Individuelle Berichte
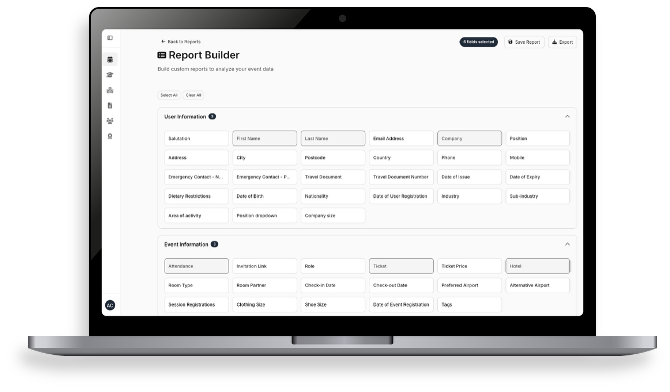
Wählen Sie Felder aus Eventdaten, Gästeinformationen, Registrierungsantworten und Einwilligungen. Speichern Sie die Auswahl als Vorlage für die nächste Ausgabe und exportieren Sie sie bei Bedarf als CSV- oder Excel-Datei.
Weitere Einblicke
Weitere Berichte zeigen Kommunikation, Feedback, Partneraktivität und die Zielgruppe Ihres Hubs.
Sehen Sie pro E-Mail, was zugestellt, geöffnet, angeklickt oder zurückgewiesen wurde.
Werten Sie Feedback zum gesamten Event oder zu einzelnen Sessions aus.
Sehen Sie gescannte Leads nach Marke und Teammitglied.
Verfolgen Sie das Wachstum Ihrer Hub-Zielgruppe über mehrere Events hinweg.
Gut zu wissen
Ja. Alle Berichte lassen sich als CSV- oder Excel-Datei exportieren.
Ja. Wählen Sie Felder aus Gästedaten, Registrierungsantworten und Einwilligungen und speichern Sie den Bericht als Vorlage.
Ja. Registrierungen, Verkäufe und Check-ins werden während des Events aktualisiert.
Ja. Für Sessions mit Check-in sehen Sie die Teilnahme im Verhältnis zur Kapazität.
Ja. Unterkunftsberichte zeigen Buchungen je Nacht im Verhältnis zu Ihren Kontingenten.
Verbinden Sie Google Analytics (GA4) mit Ihrer Event-Website. Ohne diese Verbindung zeigt der Website-Bericht keine Besucherdaten.