Registrations and tickets
See the totals and follow new registrations by week or month.

Reports & analytics
Registrations, sales, check-ins, website traffic and hotel bookings in one place. Build your own reports and export them in one click.
Registrations, attendance and sales at a glance
From registration to arrival
0% check-in rate
New registrations each week
Insights
Start with the numbers that tell you how the event is progressing, then open a report for the detail behind them.
See the totals and follow new registrations by week or month.
Compare tickets sold and revenue with the guests who have actually checked in.
Keep the countdown before the event and its live status on the day in view.
Event reports
Open a focused view for attendance, sales or website performance without piecing the picture together in a spreadsheet.
Compare registered, arrived and not-yet-arrived guests. See the live check-in rate and which sessions are filling up, at capacity or full.
See gross revenue over time, tickets sold against capacity, average order value and discount code use.
Connect Google Analytics (GA4) to see a 30-day visitor and page-view trend, traffic sources, popular pages, devices and visit duration. Until it is connected, the Website report has no data.
Accommodation reports
Compare booked room-nights with your allocation for each hotel and night. Follow pickup over time, spot busy and quiet nights, and check how coordinator blocks are being used.
Export a rooming list when the hotel needs the final details.
Explore accommodation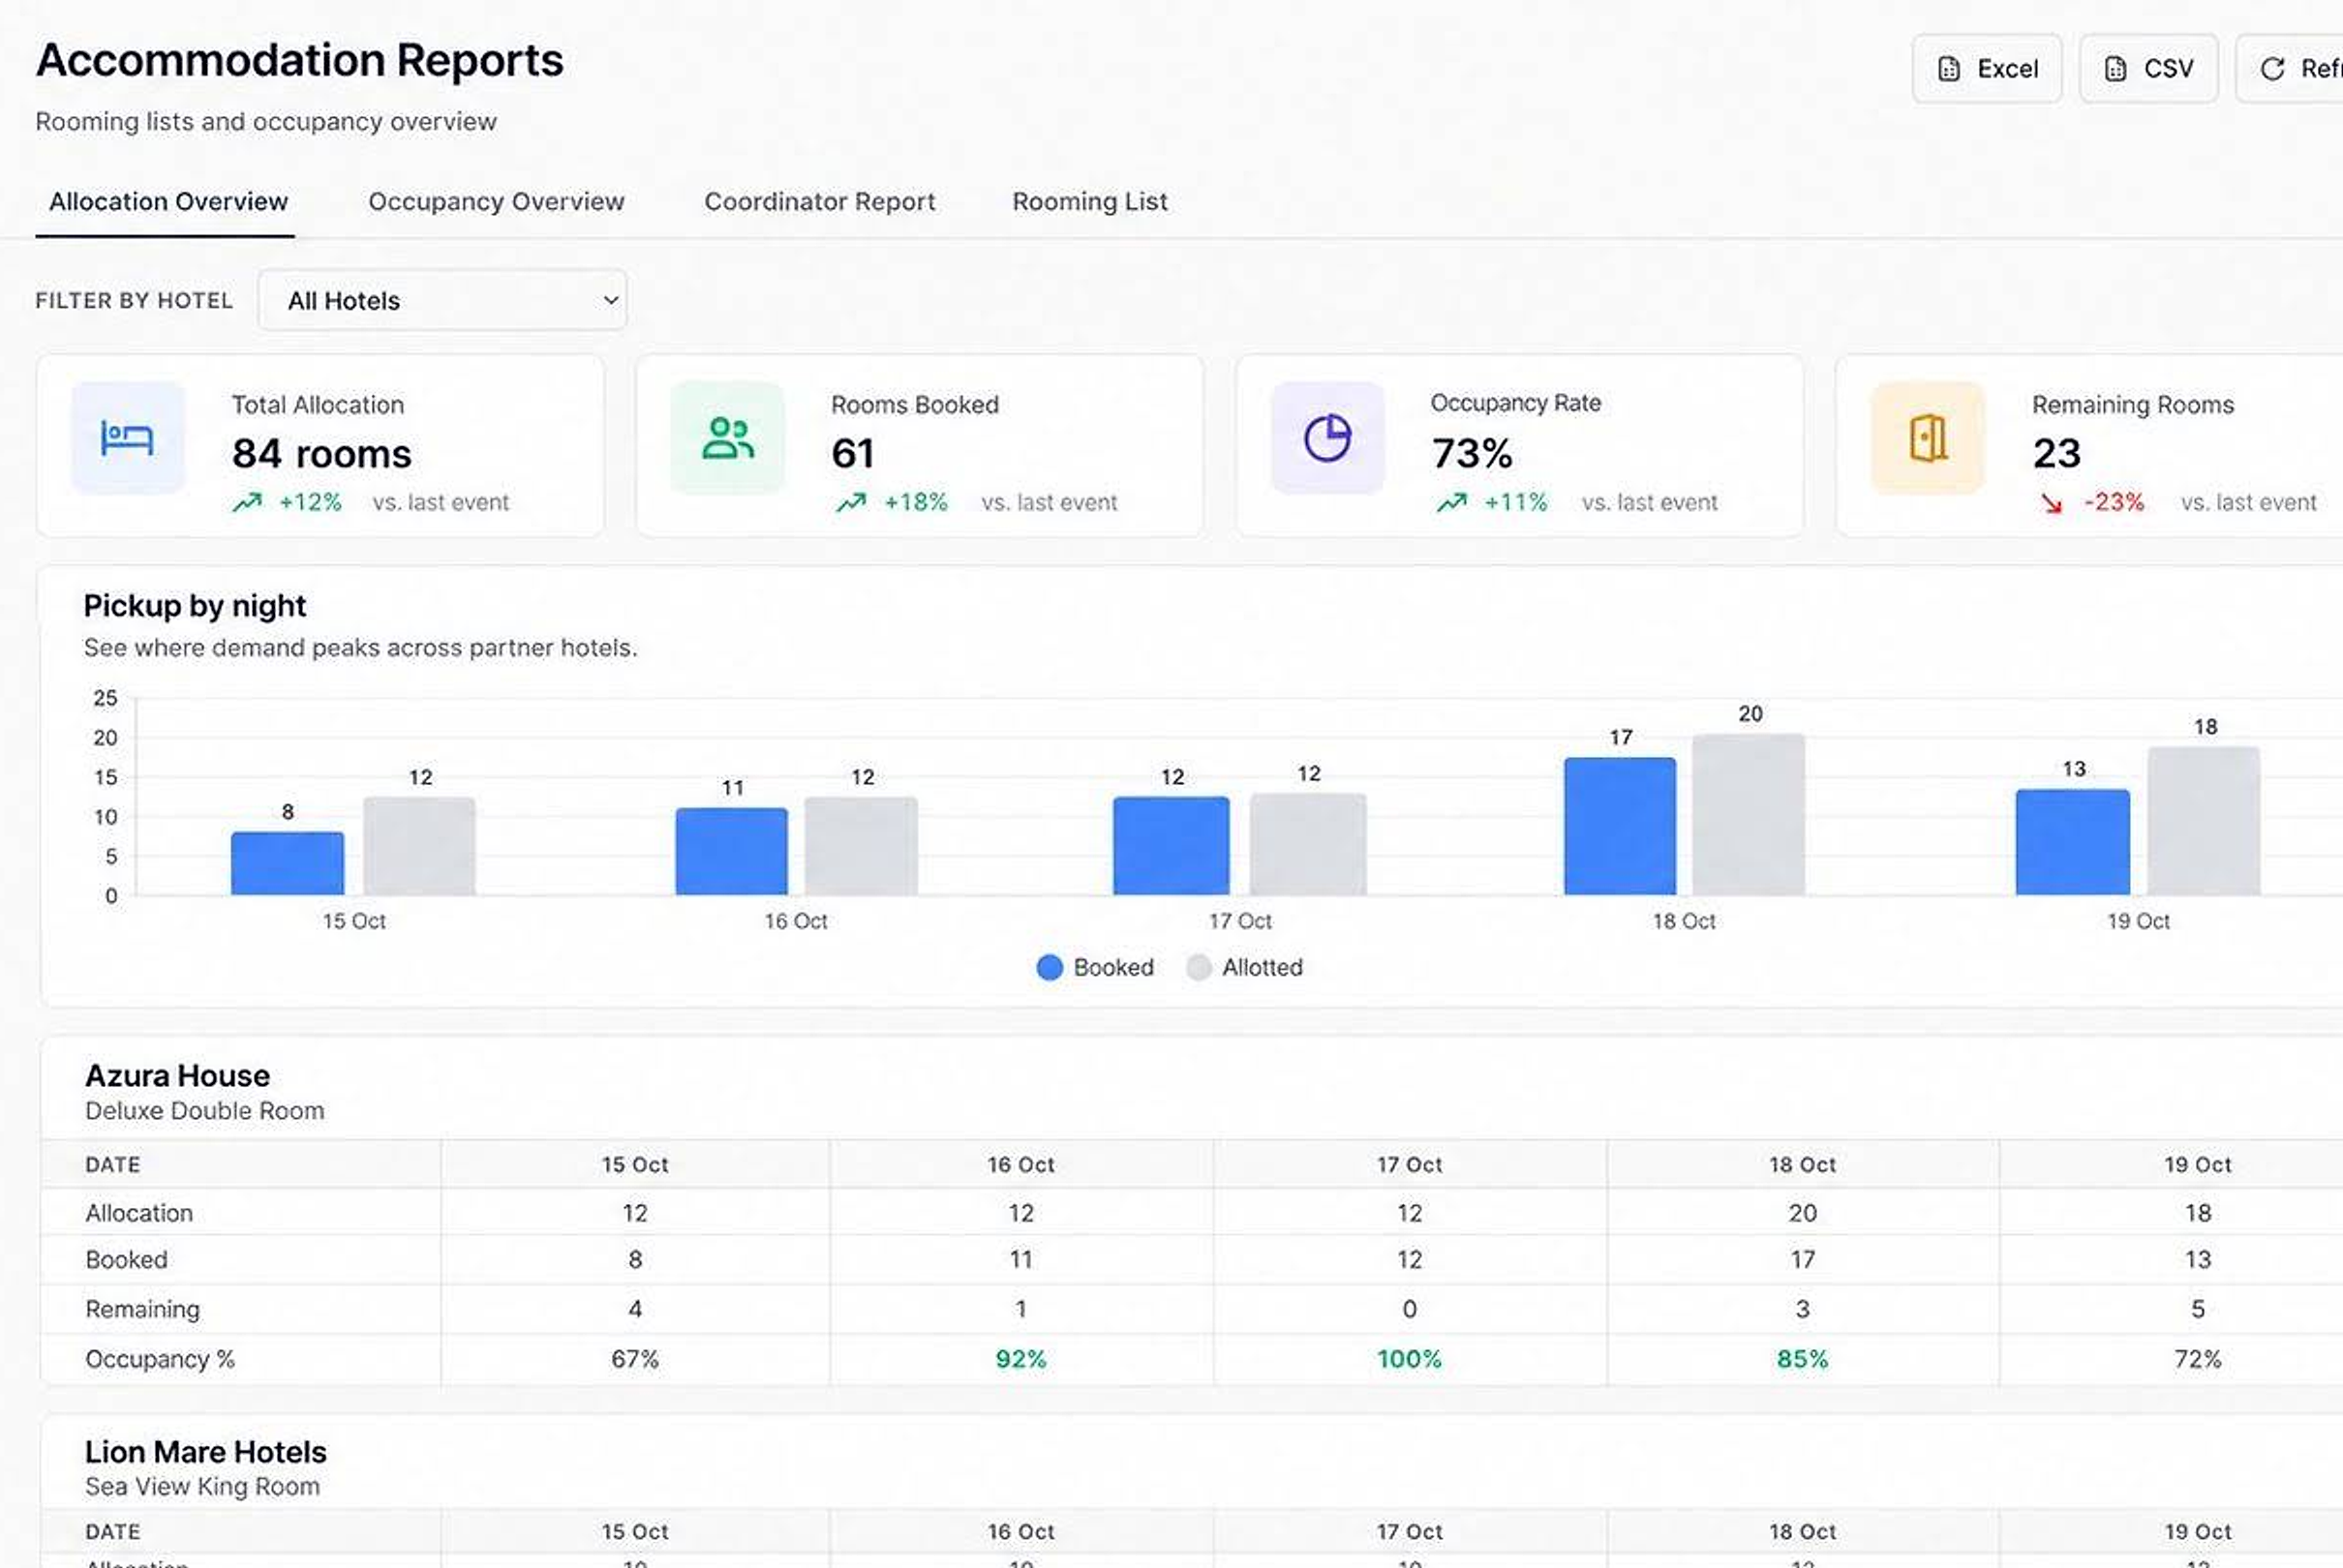
Custom reports
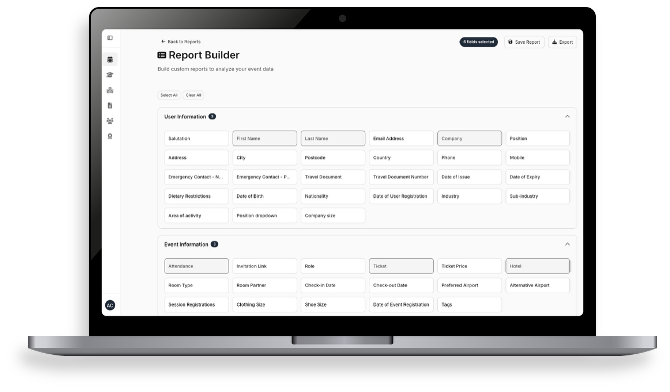
Choose fields from event details, guest information, registration answers and consent responses. Save the selection as a template for the next edition, then export to CSV or Excel whenever you need it.
More insights
Related reports help you understand communication, feedback, partner activity and the audience across your Hub.
See delivered, opened, clicked and bounced results for each email.
Review feedback for the event and individual sessions.
See scanned leads by brand and representative.
Follow audience growth across the events in your Hub.
Good to know
Yes. Every report exports as a CSV or Excel file.
Yes. Choose fields from guest details, registration answers and consent responses, then save the report as a template.
Yes. Registrations, sales and check-ins update as they happen.
Yes. Sessions with check-in show attendance against capacity.
Yes. Accommodation reports show bookings by night against the rooms you hold.
Connect Google Analytics (GA4) to your event website. The Website report does not show visitor data until it is connected.